AWS Lambda Monitoring part I: Improved logging (Python)

Jan 07, 2020

As serverless is being used more and more to build ‘real’ applications and not only used to execute small tasks, the need for monitoring becomes even more important. However, when using a serverless architecture most of the tools and practices we used when working with servers and containers are not applicable anymore.

While there are tools that generate useful information during the runtime of your function by adding instrumentation, these tend to add latency to the execution time which is something you might not want.

These tools are often commercial (Datadog, Dynatrace,..) and will cost a certain amount of money. In this blog post we want to show there is a lot we can do with the default primitives provided by AWS and the programming language we are using before we look into the commercial offerings.

NOTE: All code used in this post can be found in this GitHub repository

Getting data from your Lambda functions.

Everything that is send to stdout like print or log statements in Python will end up in CloudWatch logs. The Python logging module (available in the standard library) gives us a quite lot of flexibility on how we can log events in our application.

In this post we will use a simple Lambda function that creates logs based on the input it gets from the incoming event. With this function we can trigger an error or info level log action.

function.py

" Zoolite demo app"
import logging

# Setup logging
LOGGER = logging.getLogger(__name__)
LOGGER.setLevel(logging.INFO)


def handler(event, _):
    """ main handler """
    try:
        if event["simulation"] == "error":
            LOGGER.error("Function failed")
        if event["simulation"] == "info":
            LOGGER.info("Function started")
    except KeyError as err:
        LOGGER.error("Missing 'simulation' key in event")
        raise Exception("Missing 'simulation' key")

Example test event:

{
    "simulation": "error"
}

Let’s see how this looks like in Cloudwatch Logs when we run this function.

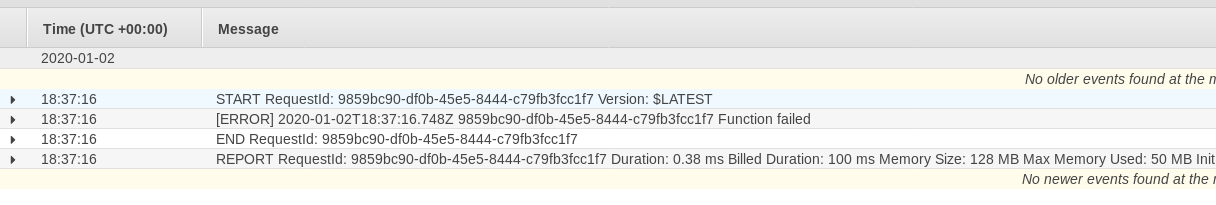
Cool, we can see that the logging module has created a log record for the given log level (in this case ERROR) including the log message and time stamp.

Structured logging in json

The goal of sending logs to CloudWatch is to extract useful information by shipping these logs to an aggregation service (ELK, Kinesis, InfluxDB,..) to further analyse this data, create metrics and so on. AWS CloudWatch provides the option to put a log subscription on a given Log Group which is perfect for this.

The default log format is not the best format to query or perform therefore we will convert the standard logging format to json formatted logs which has emerged as the de facto standard for message parsing.

To log in json format in Python we need to create a custom logging Formatter. Because we don’t want to repeat this in all functions we’ll create a module we can import in all the other Lambda functions that compose our application. Check the source in the git repository to see how it’s structured.

json_logger.py

#!/usr/bin/env python
# coding=utf-8
import logging
import json
import time
import os


class JSONFormatter(logging.Formatter):
    """ JSON formatter """
    def format(self, record):
        """ Format event info to json."""
        string_formatted_time = time.strftime("%Y-%m-%dT%H:%M:%S", time.gmtime(record.created))
        obj = {}
        obj["message"] = record.msg
        obj["level"] = record.levelname
        obj["time"] = f"{string_formatted_time}.{record.msecs:3.0f}Z"
        obj["epoch_time"] = record.created
        if hasattr(record, "custom_logging"):
            for key, value in record.custom_logging.items():
                obj[key] = value
        return json.dumps(obj)


def setup_logger():
    """ Create logging object."""
    logger = logging.getLogger(__name__)

    handler = logging.StreamHandler()
    formatter = JSONFormatter()
    handler.setFormatter(formatter)

    logger.addHandler(handler)

    if "DEBUG" in os.environ and os.environ["DEBUG"] == "true":
        logger.setLevel(logging.DEBUG)  # pragma: no cover
    else:
        logger.setLevel(logging.INFO)
        logging.getLogger("boto3").setLevel(logging.WARNING)
        logging.getLogger("botocore").setLevel(logging.WARNING)

    return logger

Now we can update our funtion by importing the json_logger module and initiate an instance of it to setup our logger.

function.py

" Zoolite demo app"
import json_logger

# Setup logging
LOGGER = json_logger.setup_logger()


def handler(event, _):
    """ main handler """
    try:
        if event["simulation"] == "error":
            LOGGER.error("Function failed")
        if event["simulation"] == "info":
            LOGGER.info("Function started")
    except KeyError as err:
        LOGGER.error("Missing 'simulation' key in event")
        raise Exception("Missing 'simulation' key")

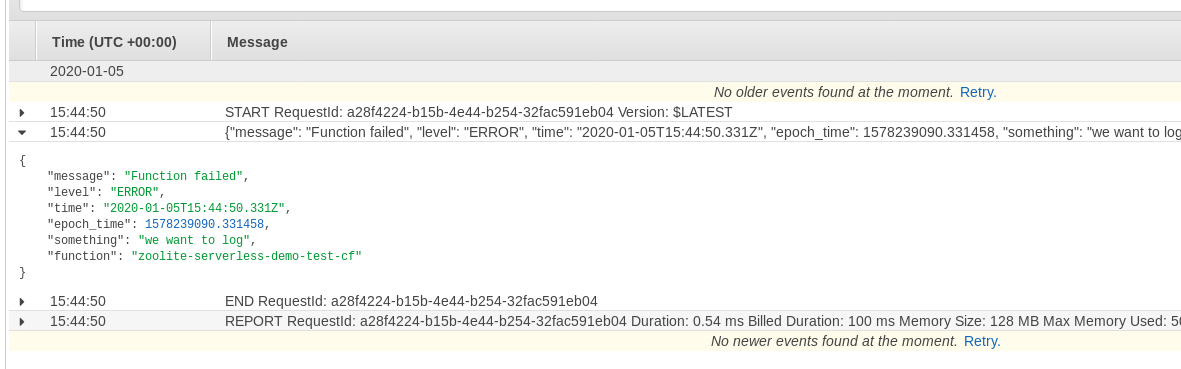
Let’s test it out by running the Lambda funtion again.

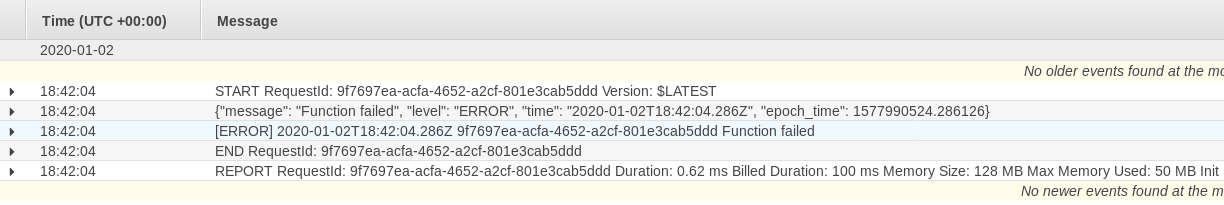
Great, our logs are now json formatted but we also see the text formatted log too. This is because the Python Lambda function comes with it’s own log handler when bootstrapped. We can remove this handler by adding logger.propagate=False to the json_logger function.

logger = logging.getLogger(__name__)
logger.propagate=False    # <---

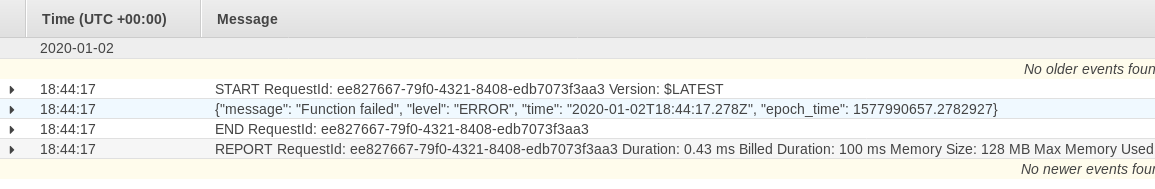
Now we only see the json formatted log line.

Adding extra information

Currently we get the message we pass to our log statement and the data of the records object from the logging module (like time created, log level, …) but in some cases we would want to add extra information to our logs. This can be achieved using the extra keyword that is available in the Python loggin module. That’s where this part of our custom formatter is being used for.

        if hasattr(record, "custom_logging"):
            for key, value in record.custom_logging.items():
                obj[key] = value

If there is an extra field with a custom_logging dictionary, it will add the key/value in that dictionary to the json object.

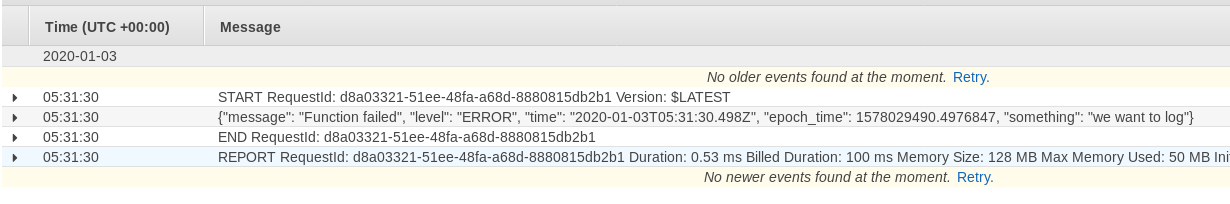
Example log statement passing an extra_logging dictionary to the extra argument.

function.py

def handler(event, _):
    """ main handler """
    extra_logging = {"custom_logging": {"something": "we want to log"}}
    try:
        if event["simulation"] == "error":
            LOGGER.error("Function failed", extra=extra_logging)
        if event["simulation"] == "info":
            LOGGER.info("Function started")
    except KeyError as err:
        LOGGER.error("Missing 'simulation' key in event")
        raise Exception("Missing 'simulation' key")

Result:

Adding default information

It can be useful to add default information to our logs without having to specify it each time we log something. An example could be the name of the function name. By adding it to each log record by default we can filter out log messages per function name when we start analysing or logs

To achieve this we need to add a custom log adapter to our logging module and return the adapter instance in the setup_logger function.

custom_logger.py

class CustomAdapter(logging.LoggerAdapter):
    """ Add general items (function name) to the log message """
    def process(self, msg, kwargs):
        function = kwargs.pop('function', self.extra['function'])
        if "extra" in kwargs:
            if "custom_logging" in kwargs["extra"]:
                kwargs["extra"]["custom_logging"]["function"] = function
        return msg, kwargs


class JSONFormatter(logging.Formatter):
    """ JSON formatter """
    def format(self, record):
        """ Format event info to json."""
        string_formatted_time = time.strftime("%Y-%m-%dT%H:%M:%S", time.gmtime(record.created))
        obj = {}
        obj["message"] = record.msg
        obj["level"] = record.levelname
        obj["time"] = f"{string_formatted_time}.{record.msecs:3.0f}Z"
        obj["epoch_time"] = record.created
        if hasattr(record, "custom_logging"):
            for key, value in record.custom_logging.items():
                obj[key] = value
        return json.dumps(obj)


def setup_logger(function):
    """ Create logging object."""
    logger = logging.getLogger(__name__)
    logger.propagate = False  # remove default logger

    handler = logging.StreamHandler()
    formatter = JSONFormatter()
    handler.setFormatter(formatter)

    adapter = CustomAdapter(logger, function)
    logger.addHandler(handler)

    if "DEBUG" in os.environ and os.environ["DEBUG"] == "true":
        logger.setLevel(logging.DEBUG)  # pragma: no cover
    else:
        logger.setLevel(logging.INFO)
        logging.getLogger("boto3").setLevel(logging.WARNING)
        logging.getLogger("botocore").setLevel(logging.WARNING)

    return logger, adapter

When we initialize the logger we can pass the data we want to be available to our logs by default. In this example we add the Lambda function’s name.

As you might have noticed or function returns a logger and adapter which we can use to log information. When using the adapter the default information will be added to the log.

function.py

import os
import custom_logger

# Setup logging
FUNCTION_NAME = {"function": os.getenv("AWS_LAMBDA_FUNCTION_NAME")}
LOGGER, ADAPTER = custom_logger.setup_logger(FUNCTION_NAME)

def handler(event, _):
    """ main handler """
    extra_logging = {"custom_logging": {"something": "we want to log"}}
    try:
        if event["simulation"] == "error":
            ADAPTER.error("Function failed", extra=extra_logging)
        if event["simulation"] == "info":
            LOGGER.info("Function started")
    except KeyError as err:
        LOGGER.error("Missing 'simulation' key in event")
        raise Exception("Missing 'simulation' key")

When we test this we see that the function name was added to the log.

In this post we had a look at what we can do to optimize our logs in way they are useful to process/analyse later on. The advanage is that we don’t need to invest in 3rd party tools.

In a next blog post we’ll explain how we can send these log data to InfluxDB and use that as a datasource in Grafana.

We hope you enjoyed this post and that it was useful to you. If there are remarks, things to improve or wrong please let us know on twitter or by sending us an email.